
Digital marketing changes so quickly that a statistic can go from “current” to “outdated” without anyone noticing.
A social platform grows.
AI changes search behavior.
Ad budgets move.
A new generation adopts a different platform.
And suddenly, last year’s marketing strategy is being built on last year’s internet.
So instead of another article filled with random numbers, here’s a more useful question:
What does the digital marketing landscape actually look like in 2026?
This guide brings together more than 100 important digital marketing statistics covering:
- Internet usage
- Mobile
- Social media
- AI
- Search
- SEO
- Digital advertising
- Video
- Creator marketing
- Consumer behavior
- Ecommerce
- India
- Marketing technology
- Digital trends
And more importantly, each number comes with context.
Because a statistic without context can be misleading.
For example, “500 million Instagram users in India” sounds straightforward.
But that figure refers to advertising reach, not necessarily monthly active users.
That’s why throughout this guide we’ll distinguish between:
Users
Ad reach
Survey responses
Market size
Forecasts
Reported platform metrics
Those aren’t interchangeable.
The Digital Marketing Landscape in 2026: The Big Picture
Before getting into 100+ individual statistics, let’s understand the scale of the digital world.
1. There are more than 6 billion internet users worldwide.
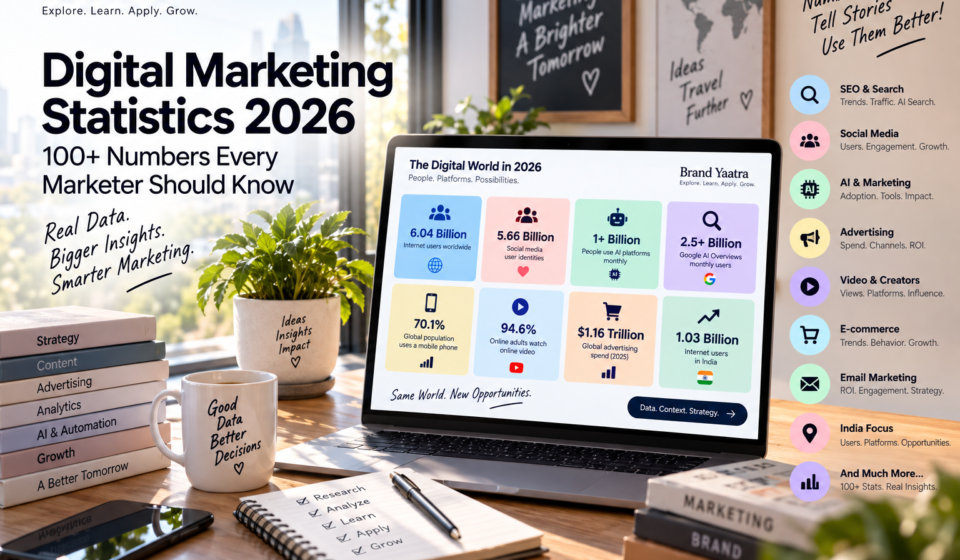
DataReportal’s 2026 global analysis puts the number of internet users at approximately 6.04 billion based on data available in October 2025.
That represents roughly 73.2% of the world’s population.
The number is important, but the bigger story is that digital is no longer a niche environment.
It is where most of the connected world lives, searches, watches, researches, communicates and shops.
2. Internet users grew by 294 million year over year.
The global internet user figure increased by about 294 million, or 5.1%, over the previous year.
However, DataReportal warns that revisions to internet adoption data in India played a significant role in this increase.
This is a good reminder:
Year-over-year changes in datasets can sometimes reflect methodology changes, not just real-world behavior.
3. About 2.21 billion people were still offline.
Despite more than 6 billion people being online, approximately 2.21 billion people remained offline in October 2025.
Digital marketing may feel universal from inside the marketing industry.
It isn’t.
There is still a huge offline population.
4. 70.1% of the world’s population used a mobile phone.
GSMA Intelligence estimated approximately 5.78 billion unique mobile users worldwide in October 2025.
That represented about 70.1% of the world’s population.
5. 86.9% of mobile phone handsets were smartphones.
Ericsson’s data cited by DataReportal indicates that smartphones accounted for approximately 86.9% of mobile phone handsets in use.
The implication is obvious:
For most digital marketers, mobile isn’t a secondary experience.
It is the primary environment.
6. Smartphones accounted for 83.7% of cellular connections.
Smartphones represented approximately 83.7% of total cellular mobile connections.
That reinforces the importance of mobile-first content, advertising, websites and commerce.
7. 58.4% of the global population lived in urban areas.
Urbanization matters to marketers because digital adoption and commercial infrastructure often concentrate around cities.
But the relationship between urbanization and internet access isn’t perfect.
8. 70.7% of women worldwide were online.
DataReportal’s analysis found that approximately 70.7% of women worldwide were internet users.
9. 75.7% of men worldwide were online.
That creates a global internet gender gap of roughly 5 percentage points.
10. Rural internet adoption was 54.5%.
Only about 54.5% of the world’s rural population was online according to the cited analysis.
By comparison, internet adoption among urban populations was approximately 86.5%.
That is a massive digital-access gap.
Social Media Statistics 2026
Social media isn’t disappearing.
It is becoming infrastructure.
The interesting question isn’t whether people use social media.
It’s how they use it, why they use it and what they expect from it.
11. There were 5.66 billion social media user identities worldwide.
DataReportal’s October 2025 analysis identified approximately 5.66 billion active social media user identities.
Important: “user identities” does not necessarily mean unique human beings.
12. Social media user identities represented 68.7% of the world’s population.
That means roughly 2 out of every 3 people on Earth were represented in the global social media user figure.
13. Social media user identities grew 4.8% year over year.
The global total increased by approximately 259 million identities over the year.
14. Around 96.9% of internet users aged 16+ used social media monthly.
GWI data cited by DataReportal indicates that 96.9% of internet users aged 16 and above use at least one social platform each month.
15. People used an average of 6.75 social platforms per month.
This is one of the most important numbers for marketers.
Your customer probably isn’t “an Instagram user.”
They may use several platforms.
16. Online adults used social media on 4.21 days per week on average.
Social media isn’t necessarily a once-a-week activity.
For most connected adults, it is part of the weekly routine.
17. People aged 16–24 used social media on 4.6 days per week.
Younger audiences remain especially frequent social users.
18. Nigerian respondents reported using social media 5.84 days per week.
That was the highest figure among the countries covered by the referenced GWI dataset.
19. Women aged 16–24 spent 25 hours 45 minutes per week on social and video feeds.
That’s more than 3 hours 40 minutes per day on average.
20. Global online adults spent 18 hours 36 minutes per week on social and video feeds.
That works out to more than 2.5 hours per day.
21. Online adults spent about 33.5 hours per week consuming online media.
This includes activities such as social media, online video and streaming television.
22. About 29% of waking life was spent consuming online media.
That figure is an estimate derived from the broader media-use data cited by DataReportal.
23. 50.2% of adult social media users said keeping in touch was a primary motivation.
Social media may be used for marketing, but the underlying human motivation remains social connection.
24. 39.7% cited filling spare time as a primary social-media motivation.
This helps explain why entertainment-driven content performs so strongly.
25. 35.4% cited reading news stories as a primary motivation.
Social media is therefore also a significant information environment.
Which Social Platforms Matter?
Platform size isn’t enough.
A marketer needs to understand:
Reach + attention + audience + intent + behavior.
26. WhatsApp was the world’s favorite social platform among 16+ users.
GWI’s survey found 17.4% of respondents selected WhatsApp as their favorite platform.
27. Instagram ranked second at 16.4%.
Instagram’s position is especially strong among younger audiences.
28. Facebook ranked third at 13%.
Facebook remains highly relevant despite years of predictions about its decline.
29. TikTok ranked fifth at 9.1%.
TikTok remains one of the world’s strongest attention platforms.
30. The top five favorite platforms captured 67.3% of the vote.
The top platforms therefore account for a substantial share of declared preference.
31. TikTok users spent about 1 hour 37 minutes per day on its Android app.
Similarweb data cited by DataReportal put TikTok at approximately 97 minutes per day among its typical Android users.
32. Instagram users spent about 1 hour 13 minutes per day.
That’s approximately 73 minutes per day.
33. Facebook users spent about 67 minutes per day.
34. WhatsApp users spent about 59 minutes per day.
35. WhatsApp users opened the Android app more than 20 times per day.
That is a very different usage pattern from a platform designed primarily around long-form browsing.
Frequency matters.
36. TikTok users opened the app about 10 times per day.
37. YouTube users opened the app about 5.9 times per day.
38. A typical YouTube Android session lasted 14 minutes 29 seconds.
That was the longest average session among the major social apps discussed in the report.
39. A typical TikTok session lasted 9 minutes 42 seconds.
40. A typical Instagram session lasted 5 minutes 56 seconds.
This is why “time spent” and “session length” should not be confused.
AI Marketing Statistics 2026
AI is no longer a future marketing trend.
It is becoming part of the everyday information ecosystem.
But there is an important distinction:
AI adoption is growing quickly, while exact global user counts remain difficult to measure.
41. More than 1 billion people use standalone AI platforms each month.
DataReportal’s analysis indicates that more than 1 billion people worldwide now use standalone LLM or generative-AI platforms each month.
This is an estimate rather than a single platform’s reported user count.
42. ChatGPT had around 800 million weekly users according to an October 2025 statement.
OpenAI CEO Sam Altman reported approximately 800 million weekly users during an event in October 2025.
43. Similarweb data suggested more than 550 million monthly ChatGPT mobile-app users.
This is a third-party usage estimate, not OpenAI’s official monthly active-user figure.
44. Similarweb recorded close to 500 million unique device identities visiting ChatGPT’s web platform in August 2025.
Again, this is a measurement of web/device activity, not a direct count of unique people across every channel.
45. More than 2.5 billion people use Google AI Overviews each month.
Google reported this figure in 2026.
That makes AI-generated answers inside Search one of the largest AI-distribution surfaces in the world.
46. Google AI Mode surpassed 1 billion monthly users.
Google reported that AI Mode crossed 1 billion monthly users in 2026.
47. Google Search queries reached an all-time high after AI features expanded.
Google said AI-powered Search was associated with people searching more, not less.
That challenges the simplistic idea that:
AI = the death of search.
48. More than 900 million people use the Gemini app monthly.
Google reported more than 900 million monthly active users for the Gemini app in June 2026.
49. About half of online adults said they were excited about AI.
GWI data cited by DataReportal indicates that close to 50% of online adults expressed excitement about artificial intelligence.
50. GenAI users increased by more than 1.4 billion in the year to April 2026.
DataReportal’s mid-year 2026 analysis estimated 2.42 billion active GenAI user identities globally.
The important caveat is that these may not represent unique human beings.
Search & SEO Statistics 2026
If you’re an SEO professional, this section matters most.
Because the data doesn’t support either extreme:
“SEO is dead.”
or
“Nothing has changed.”
The reality is somewhere in between.
51. 80.3% of online adults said they had used a search engine in the past month.
This remains enormous.
Search is changing, but it isn’t disappearing.
52. Search-engine usage declined by a relative 2.5% year over year.
DataReportal calculated a decline of approximately 210 basis points in the share of online adults reporting monthly search-engine use.
53. Google accounted for close to 90% of search-engine referrals to third-party websites.
Google remains the dominant search referral source.
54. Google website traffic declined only about 1–2% over the two-year period analyzed.
That is far less dramatic than many “Google is dead” headlines imply.
55. Search remained the number-one source of brand discovery.
Nearly 1 in 3 internet users aged 16+ said they discover new products and services through search engines.
56. Search remained the primary destination for purchase research.
Consumers continue to use search when researching products and services.
This is particularly important for high-intent categories.
57. Global search advertising was projected at $352 billion in 2025.
That makes search advertising one of the largest advertising categories in the world.
58. Search advertising was projected to grow 11.1% in 2025.
Search isn’t a stagnant market.
59. Search advertising had more than doubled since 2020.
The growth of digital advertising has been particularly significant in search.
60. Google AI Overviews reached more than 2.5 billion monthly users.
For SEO, this means the search result itself increasingly includes an AI-generated layer.
The question isn’t only:
“Can I rank?”
It is increasingly:
“Can my information become part of the answer?”
Digital Advertising Statistics 2026
Advertising remains one of the biggest engines of the digital economy.
And the numbers are enormous.
61. Global advertising spend was projected at $1.16 trillion in 2025.
DataReportal’s analysis of Statista data put total global advertising expenditure at approximately $1.16 trillion.
62. Global advertising spend grew 6.5% year over year.
63. Digital channels represented 74.4% of global advertising spend.
That means roughly three-quarters of advertising investment had moved into digital channels.
64. Digital’s share rose from 72.7% to 74.4%.
That is a 1.7 percentage-point increase.
65. Global search advertising was projected at $352 billion.
Search remained the single largest digital advertising category in the global dataset.
66. Search ad spend represented roughly $1 billion per day.
$352 billion spread across a year comes to just under $1 billion per day.
67. Social advertising was projected at $277 billion.
68. Social ad spend was projected to grow 13.6%.
That was faster than overall global advertising growth.
69. Advertisers were spending more than $5 billion per week on social ads.
70. Online retail advertising represented 23.7% of digital ad spend in the cited Statista dataset.
Retail media is therefore no longer a niche advertising format.
71. Global online retail advertising was projected at $204 billion.
72. Retail-media advertising was growing 22% year over year.
This is one reason Amazon, Walmart and other commerce platforms increasingly compete for advertising budgets.
U.S. Digital Advertising: The Latest Benchmark
The U.S. has some of the most mature digital-advertising measurement in the world.
IAB/PwC’s 2025 report provides a useful benchmark.
73. U.S. internet advertising revenue reached $294.6 billion in 2025.
This was a record for the IAB/PwC series.
74. U.S. digital advertising revenue grew 13.9% in 2025.
75. Social advertising generated $117.7 billion.
76. Search advertising generated $114.2 billion.
77. Digital video generated $78 billion.
78. Commerce media generated $63.4 billion.
79. Display advertising generated $81.6 billion.
80. Podcast advertising reached $2.9 billion.
81. Programmatic advertising reached $162.4 billion.
82. Programmatic advertising grew 20.5%.
That means automated buying is taking an increasingly large role in digital media.
83. Digital video grew 25.4%.
Video was one of the fastest-growing major advertising formats.
84. Social advertising grew 32.6%.
This was one of the strongest growth rates among the major categories.
85. Commerce media grew 18%.
Retail and commerce platforms are increasingly becoming advertising businesses.
86. Search advertising grew 11%.
Search remained the largest category by revenue even as growth moderated.
Creator Economy Statistics
Creators are no longer just “influencers.”
They are increasingly treated as a media channel.
87. U.S. creator advertising spend reached $37 billion in 2025.
IAB projected this figure in its 2025 Creator Economy Ad Spend & Strategy Report.
88. Creator advertising spend grew 26% year over year.
89. Creator advertising spend more than doubled between 2021 and 2024.
It increased from approximately $13.9 billion to $29.5 billion.
90. Creator advertising was projected to reach $44 billion in 2026.
91. 48% of creator-ad buyers considered creators a “must buy.”
Creators are increasingly becoming part of the standard media mix.
92. Three out of four brands were using or planning to use AI for creator marketing.
That means AI is affecting not only content creation but also the infrastructure around creator partnerships.
Video Marketing Statistics
Video has become one of the most important forms of digital communication.
But the numbers show something more interesting:
Video isn’t just a social-media format.
It’s becoming a cross-platform media environment.
93. 94.6% of online adults watched online video in the previous 30 days.
94. 91.1% watched online video in the previous seven days.
95. 91.7% consumed streaming TV content monthly.
96. 69.9% watched streaming TV weekly.
97. Streaming represented 50.4% of total TV watch time among internet users.
Streaming has therefore crossed an important threshold:
more than half of TV time.
98. YouTube represented 13.1% of total U.S. TV viewing time in August 2025.
Nielsen’s data put YouTube ahead of individual traditional and streaming competitors in total TV viewing share.
99. YouTube’s share of U.S. TV viewing increased from 10.6% to 13.1% year over year.
That is a substantial increase.
100. 56% of global marketers planned to increase CTV spending.
The figure cited by DataReportal comes from Nielsen’s research.
India Digital Marketing Statistics 2026
India deserves its own section.
Not because Brand Yaatra is based around India alone, but because India’s digital market is now too large to treat as a footnote.
One of the biggest changes in the latest data is simply the scale of internet adoption.
101. India had about 1.03 billion internet users.
DataReportal’s 2026 India report puts the figure at approximately 1.03 billion users based on data available at the end of 2025.
102. India’s internet penetration was about 70%.
103. India added approximately 223 million internet users year over year.
That represented growth of approximately 27.7% in the cited dataset.
104. Around 440 million Indians remained offline.
That means the Indian internet opportunity is still not finished.
105. India had approximately 1.06 billion cellular mobile connections.
106. Mobile connections represented 72.5% of India’s population.
107. 95.6% of Indian mobile connections were considered broadband.
The definition includes 3G, 4G and 5G connections.
108. India had approximately 500 million social-media user identities.
That represented about 34.1% of the total population.
Again, these are user identities, not necessarily unique human beings.
109. India’s median age was 28.8.
This matters enormously for marketers.
India has a relatively young population entering a deeply digital economy.
110. 37.5% of India’s population lived in urban areas.
That means 62.5% lived in rural areas.
Digital marketing in India therefore cannot be thought of as an urban-only phenomenon.
India’s Major Social Platforms
Now let’s look at the individual platform numbers.
Important:
These are advertising-reach estimates where the source identifies them as such.
They should not be described as monthly active users.
111. YouTube’s advertising reach in India was 500 million.
That represented approximately 48.7% of India’s internet-user base.
112. 38.8% of YouTube’s adult ad audience in India was female.
113. 61.2% was male.
114. Facebook’s reported advertising reach in India was 403 million.
115. Facebook’s ad reach represented 27.5% of India’s total population.
116. Facebook’s ad reach represented 39.3% of India’s internet-user base.
117. Instagram’s reported advertising reach in India was 481 million.
118. Instagram’s ad reach represented 32.8% of India’s total population.
119. Instagram’s ad reach represented 46.8% of India’s internet-user base.
120. 43.9% of Indian adults were within Instagram’s reported ad reach.
That makes Instagram particularly important for brands targeting Indian adults.
121. Instagram’s Indian ad audience grew by 89.5 million year over year.
That represented approximately 22.9% growth in reported advertising reach.
122. LinkedIn reported 170 million members in India.
This number represents registered members, not monthly active users.
123. LinkedIn’s Indian advertising reach grew by 30 million year over year.
That represented about 21.4% growth in the reported audience.
124. Snapchat’s reported Indian ad reach was 213 million.
125. Reddit’s reported Indian ad reach was 30.8 million.
126. Reddit’s reported Indian ad reach grew 235% year over year.
This is an excellent example of why platform data needs context.
A huge percentage increase from a smaller reported base does not necessarily mean the platform suddenly became India’s mainstream social network.
India’s Internet Speed Statistics
Infrastructure influences what kind of marketing is possible.
Faster connections make video, live commerce, high-resolution content and richer web experiences easier.
127. India’s median mobile download speed was 131.77 Mbps.
128. India’s median fixed download speed was 59.07 Mbps.
129. India’s median mobile speed increased by 36.7% year over year.
130. India’s fixed connection speed declined 7.4% in the cited period.
These figures show why marketers should not assume that “India’s internet experience” is one uniform thing.
Mobile and fixed connections can behave very differently.
Ecommerce & Consumer Behavior Statistics
Digital marketing isn’t ultimately about clicks.
It is about influencing decisions.
And the purchase journey increasingly moves across digital and physical environments.
131. More than 57% of internet users preferred shopping online.
The latest mid-year 2026 data show that online shopping remains more popular than physical shopping, even though physical retail has regained some preference.
132. 90.3% of respondents said digital media introduced them to new products or services.
That is one of the most important statistics in this entire article.
Digital isn’t simply a conversion channel.
It is a discovery channel.
133. 76.8% said offline channels introduced them to new brands.
Offline marketing still matters.
This is why the “digital vs traditional” debate is often too simplistic.
What These 100+ Statistics Actually Mean
Now comes the part most statistics articles skip.
A list of 100 numbers isn’t useful unless you understand what the numbers mean.
And there are several clear patterns.
1. Digital isn’t replacing everything. It’s becoming the infrastructure around everything.
More than 6 billion people are online.
But people don’t live in separate boxes called:
Online
and
Offline.
They move between them.
They see a product on Instagram.
Search it on Google.
Watch a YouTube review.
Ask an AI tool.
Visit a store.
Compare prices.
Read reviews.
Buy online.
Then post about it.
Marketing therefore needs to think in journeys, not isolated channels.
2. Search is changing, but it isn’t dead
This is perhaps the biggest lesson from the 2026 data.
Search usage has changed.
AI has changed information discovery.
Google’s search interface is changing.
AI Overviews and AI Mode are expanding.
But search remains a massive discovery and research mechanism.
The smart strategy isn’t:
SEO OR AI
It is:
SEO + GEO + brand authority + useful content.
3. Social media is now an attention infrastructure
Nearly 70% of the world’s population is represented in social media user-identity estimates.
People spend more than 18 hours per week on social and video feeds.
That means social media isn’t simply a place to “post content.”
It is an attention environment.
Brands need to understand:
- Entertainment
- Community
- Conversation
- Discovery
- Search
- Social proof
- Creators
- Commerce
4. AI is becoming a distribution layer
This is where things get especially interesting for Brand Yaatra.
AI is no longer just a productivity tool.
AI systems are increasingly becoming:
- Search interfaces
- Research assistants
- Recommendation systems
- Shopping assistants
- Content discovery systems
- Decision-support tools
That means brands need to think about whether their information is:
understandable, credible, structured and referenceable.
This is exactly where GEO becomes strategically important.
5. Video remains enormous
More than 94% of online adults watched online video in the previous month.
That doesn’t mean every business needs to become a YouTube channel.
It means visual and video communication should be considered when it fits the customer journey.
6. Creator marketing is becoming media buying
Creator advertising reached tens of billions of dollars in the U.S. alone.
The important shift is from:
“Let’s hire an influencer for this campaign.”
to:
“Creators are part of our media strategy.”
That is a very different mindset.
7. India is not a secondary digital market
More than 1 billion Indians were online in the latest dataset.
That makes India one of the world’s largest digital populations.
And because hundreds of millions remain offline, there is still enormous room for future growth.
For marketers, that means:
India isn’t simply a large market.
It is one of the places where the next phase of digital marketing will be shaped.
8. The biggest marketing mistake is treating statistics as strategy
Suppose you learn:
“Instagram has 481 million users in India.”
What should you do?
Nothing.
Not yet.
The number doesn’t tell you:
- Whether your customers are there
- What they use Instagram for
- Whether your category performs
- Whether they trust brands there
- Whether your content can win attention
- Whether the economics work
A statistic gives you a clue.
It doesn’t give you a strategy.
How to Use Digital Marketing Statistics Properly
Before using any statistic in a presentation, article, strategy document or client meeting, ask five questions.
1. Who measured it?
Google?
Meta?
IAB?
GWI?
DataReportal?
Government?
A random blog?
Source quality matters.
2. What exactly was measured?
A user?
An account?
An ad-reachable audience?
A survey respondent?
Revenue?
Forecast?
Those are different things.
3. When was it measured?
A “2026 statistic” may actually be based on data collected in late 2025.
That isn’t necessarily bad.
But it should be disclosed.
4. What is the methodology?
If the methodology changed, year-over-year comparisons may become misleading.
This is especially important for platform audience estimates.
5. Does the number actually change your decision?
This is the most important question.
If the statistic doesn’t change what you do, it might just be trivia.
The 10 Digital Marketing Numbers I Would Remember
If you forget everything else in this article, remember these:
1.
6+ billion people use the internet.
2.
5.6+ billion social-media user identities exist globally.
3.
18+ hours per week are spent on social and video feeds.
4.
1+ billion people use standalone AI platforms monthly.
5.
2.5+ billion people use Google AI Overviews monthly.
6.
1+ billion people use Google AI Mode monthly.
7.
$352 billion was projected for global search advertising in 2025.
8.
$277 billion was projected for global social advertising in 2025.
9.
$37 billion was spent on U.S. creator advertising in 2025.
10.
1+ billion Indians were online in the latest 2026 dataset.
These ten numbers tell a surprisingly large part of the story.
The Bigger Picture: What Digital Marketing Looks Like in 2026
If we connect all the data, a pattern emerges.
The old digital marketing model looked something like:
Website → Search → Social → Ads → Conversion
The 2026 environment looks more like:
Search
↕
AI
↕
Social
↕
Creators
↕
Video
↕
Communities
↕
Commerce
↕
Brand
The boundaries between channels are becoming weaker.
A customer may discover your brand through:
- YouTube
- TikTok
- ChatGPT
- Google AI Overviews
- A creator
- A friend
- A marketplace
And then move between several of them before buying.
That’s why modern marketing is increasingly about being discoverable everywhere customers make decisions.
What This Means for SEO
SEO isn’t disappearing.
But the definition of visibility is expanding.
A brand can now win:
In traditional search
By ranking pages.
In AI search
By becoming useful source material.
In social search
By creating discoverable content.
In YouTube
By answering questions visually.
In communities
By becoming a trusted participant.
In marketplaces
By building product visibility and reputation.
The future therefore isn’t:
SEO vs AI.
It is:
Search visibility + AI visibility + brand authority + distribution.
What This Means for Brand Yaatra
This statistic article itself is part of the strategy.
We don’t want Brand Yaatra to publish:
“10 marketing trends you should know.”
and disappear into the internet.
We want to gradually build pages that become useful references.
That means:
Original explanation
Credible sources
Current data
Clear methodology
Useful interpretation
Regular updates
That’s how a publication can become more than a collection of blog posts.
It becomes a knowledge asset.
And eventually, when someone asks:
“How many people use social media?”
or
“How big is digital advertising?”
or
“How many Indians are online?”
we want Brand Yaatra to have a page worth discovering, reading and potentially citing.
Final Takeaway
The most important digital marketing statistic isn’t a number.
It’s the direction of change.
More people are online.
More people are using social media.
More people are using AI.
Search is evolving.
Video is growing.
Creators are becoming media channels.
Commerce and advertising are converging.
And India is becoming one of the most important digital markets in the world.
The result is a marketing environment where attention is fragmented but connected.
Your customer might discover you on Instagram, verify you through Google, research you through an AI assistant, watch your video on YouTube, read reviews on Reddit, and finally buy from your website.
The marketer’s job is no longer simply to “be on every platform.”
It is to understand how people move between them.
That is the real digital marketing story of 2026.
Frequently Asked Questions
What are the most important digital marketing statistics in 2026?
Some of the most important numbers include more than 6 billion global internet users, more than 5.6 billion social-media user identities, more than 1 billion monthly users of standalone AI platforms, more than 2.5 billion monthly users of Google AI Overviews, and more than 1 billion monthly users of Google AI Mode.
How many people use the internet in 2026?
The latest Digital 2026 dataset analyzed by DataReportal estimated approximately 6.04 billion internet users worldwide based on data available in October 2025.
How many people use social media in 2026?
DataReportal’s latest global analysis identified approximately 5.66 billion active social-media user identities in October 2025, equivalent to 68.7% of the world’s population.
How many people use AI?
Exact global AI user numbers are difficult to measure because platforms report different metrics. DataReportal’s analysis estimated that more than 1 billion people use standalone AI platforms each month, while its mid-year 2026 analysis estimated 2.42 billion active generative-AI user identities.
Is SEO still important in 2026?
Yes. Search behavior is changing, but search remains a major discovery and purchase-research channel. Google also continues to process enormous search demand while adding AI-powered experiences such as AI Overviews and AI Mode.
How big is digital advertising?
IAB/PwC reported that U.S. internet advertising revenue reached $294.6 billion in 2025. Globally, DataReportal’s analysis of Statista data projected total advertising spend at approximately $1.16 trillion in 2025, with digital channels accounting for 74.4% of that spend.
How many people use Instagram in India?
Meta’s advertising tools indicated that Instagram had an estimated advertising reach of 481 million people in India in late 2025. This is an advertising-reach estimate and should not be described as Instagram’s monthly active-user count.
How many people use YouTube in India?
Google’s advertising resources indicated a YouTube advertising reach of approximately 500 million people in India in late 2025. The figure represents advertising reach rather than necessarily monthly active users.
How many people are online in India?
The Digital 2026 India dataset estimated approximately 1.03 billion internet users in India at the end of 2025, representing about 70% internet penetration.
Why do digital marketing statistics change so often?
Statistics change because real user behavior changes, platforms revise their estimates, methodologies change, new data becomes available, and researchers sometimes replace older estimates with better official data. This is why statistics should always be accompanied by a date, source and methodology where possible.
Should marketers trust every “digital marketing statistic” online?
No. A statistic is only useful if you understand who measured it, what was measured, when it was measured and how it was measured. Platform advertising reach, monthly active users, registered members and survey respondents are different metrics and shouldn’t be treated as interchangeable.
Sources & Methodology
This article primarily uses the following high-quality sources and reports:
DataReportal — Digital 2026 Global Overview Report
Global internet, mobile, social media, AI, search, advertising, video and consumer-behavior data.
DataReportal — Digital 2026 India
India’s internet, mobile, social-media, YouTube, Facebook, Instagram, LinkedIn, Snapchat, Reddit and connectivity data.
IAB/PwC — Internet Advertising Revenue Report: Full Year 2025
U.S. digital advertising revenue, search, social, video, commerce media, display, podcast and programmatic data.
IAB — 2025 Creator Economy Ad Spend & Strategy Report
Creator advertising spend, growth and advertiser adoption.
Google — 2026 Search and AI updates
AI Overviews, AI Mode, Search usage and Gemini adoption.
Litmus — Email Marketing ROI research
Email marketing return-on-investment benchmark.
Important methodology note
Many statistics in this article are based on data collected in late 2025 and published as part of the Digital 2026 reporting cycle.
That is intentional.
DataReportal changed its publication schedule so that its annual Digital 2026 report was released ahead of 2026 planning, and it explicitly warns readers not to blindly compare figures from different editions because sources and methodologies can change.
Platform advertising-reach figures should also not automatically be described as monthly active users.
When Brand Yaatra updates this article, every major statistic should be rechecked rather than simply changing the year in the title.